How Weather Forecasts Are Created
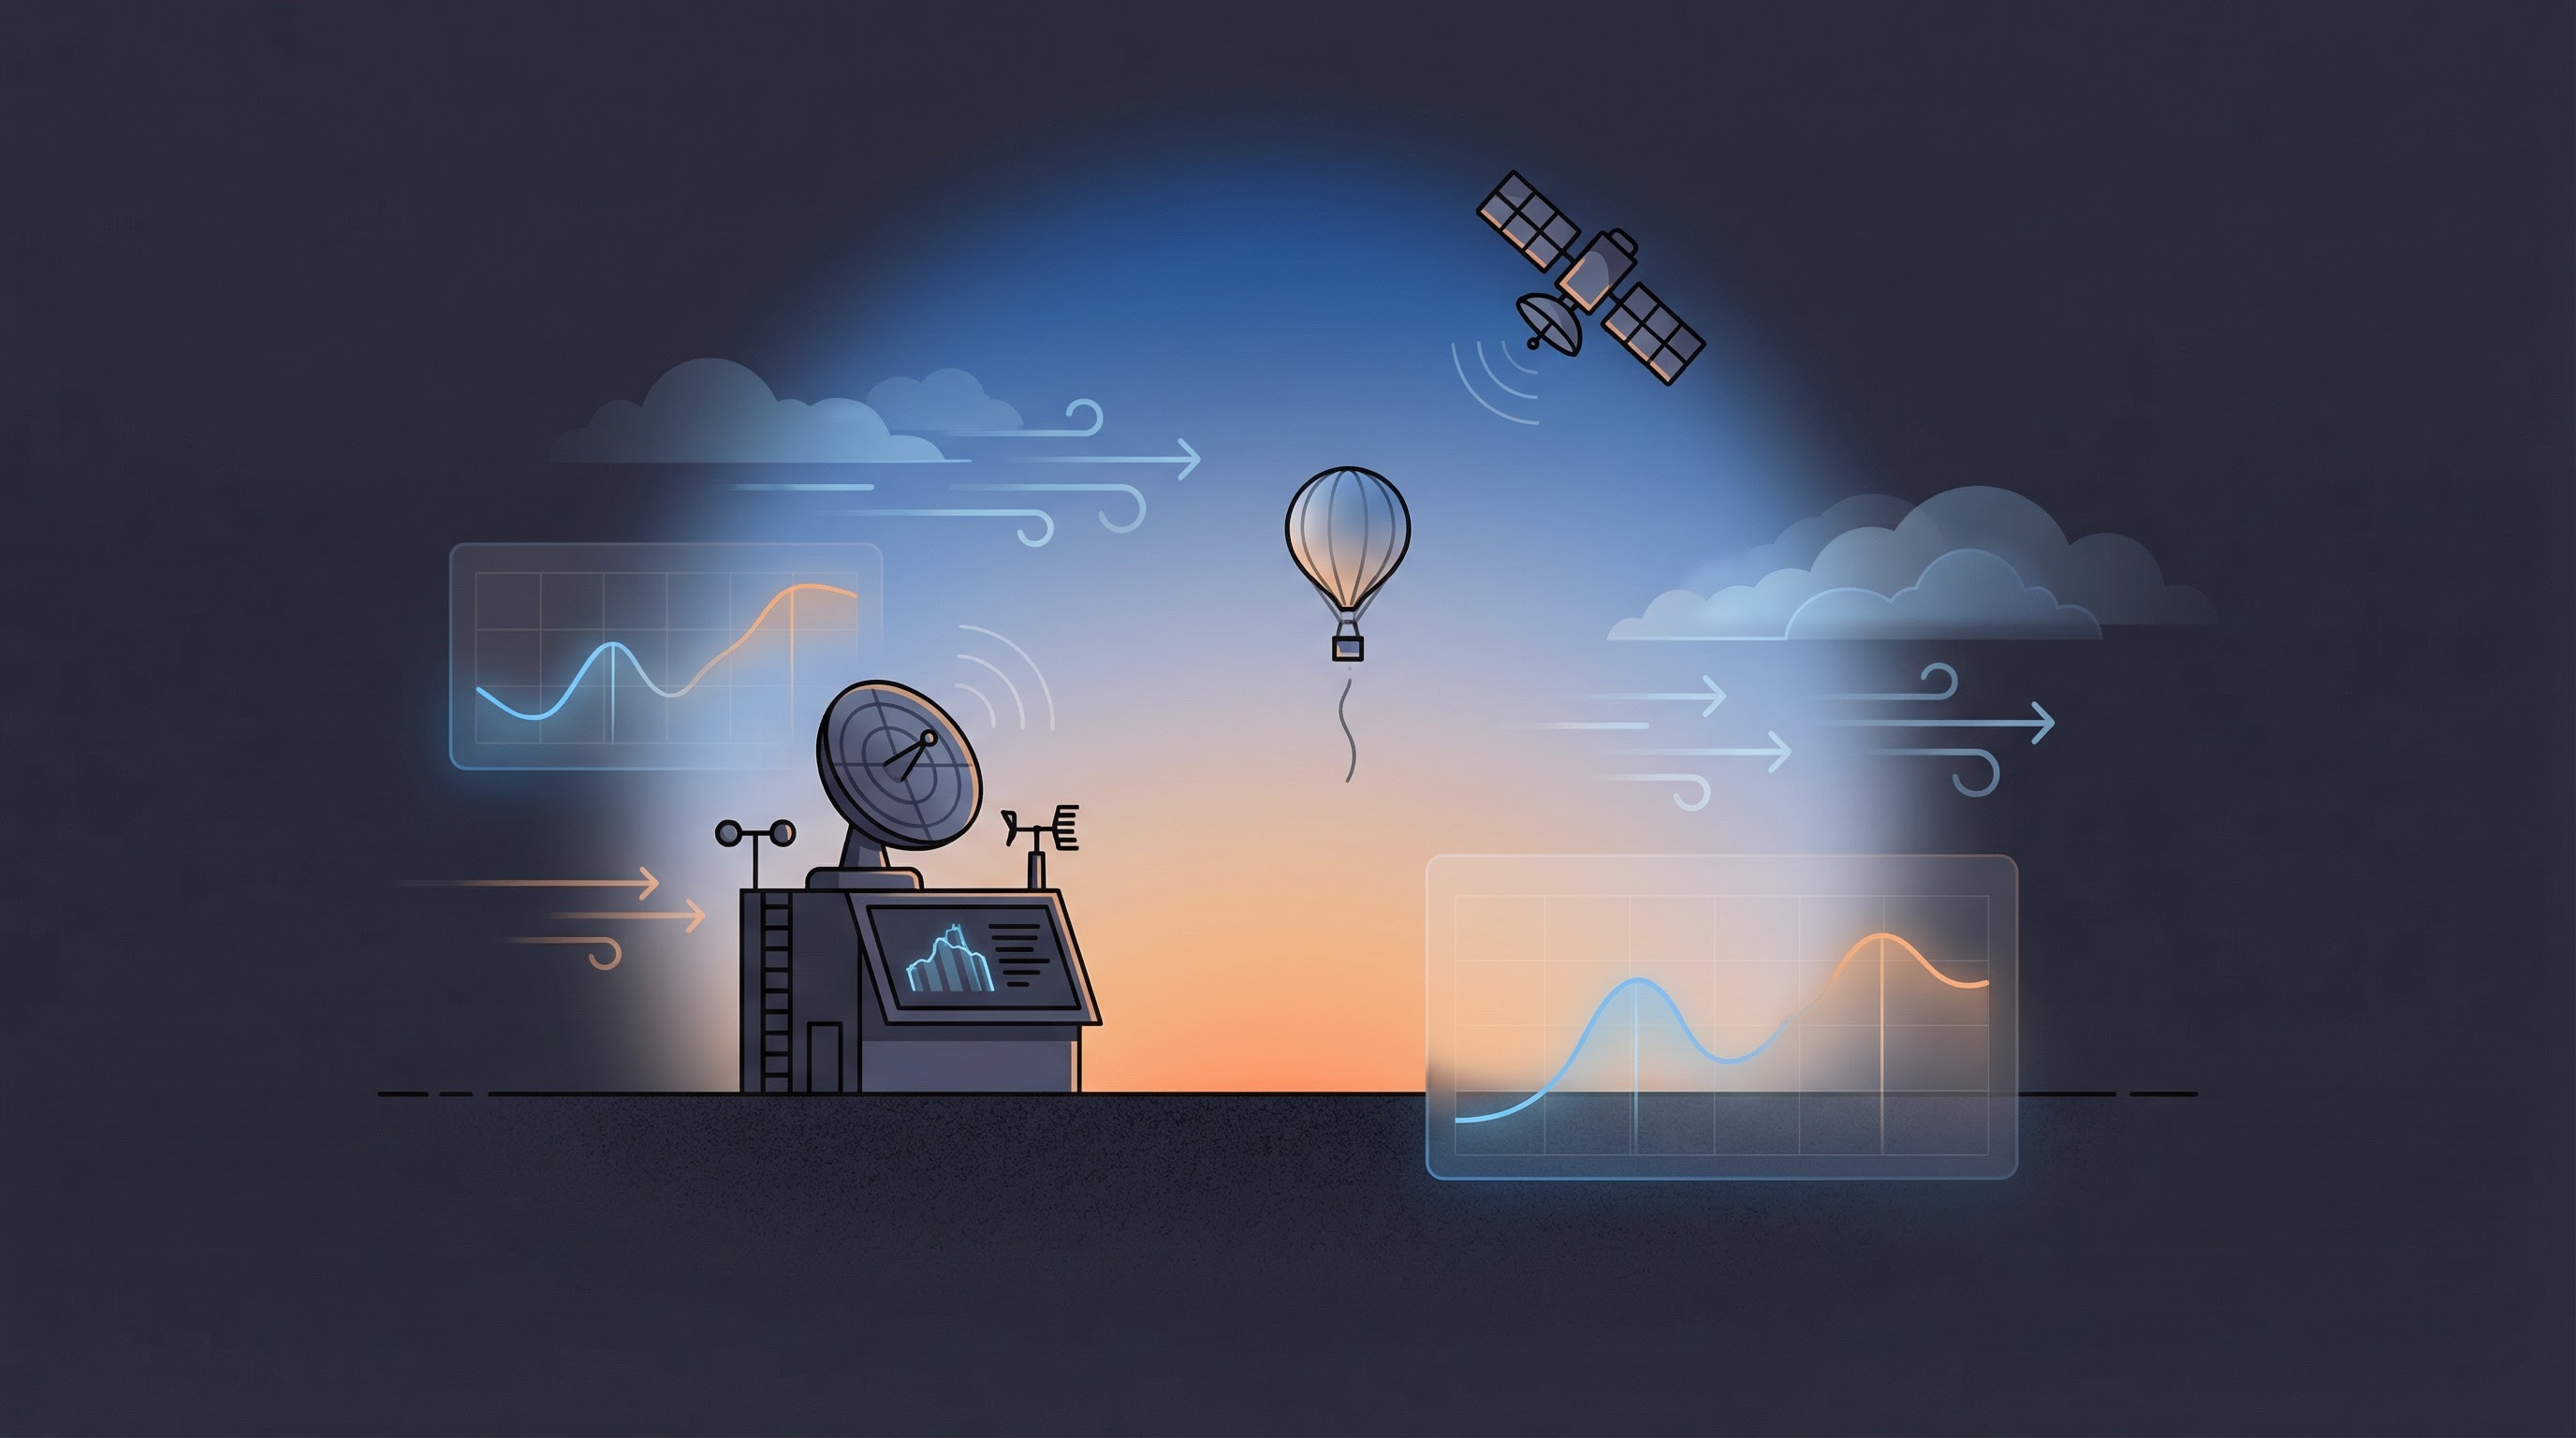
Modern weather forecasting relies on a combination of ground-based observations, satellite imagery, weather balloons, radar systems, and sophisticated computer models called Numerical Weather Prediction (NWP) systems. These models divide the atmosphere into a three-dimensional grid and use equations of fluid dynamics, thermodynamics, and radiation physics to simulate how the atmosphere will evolve over time. Major NWP models include the European Centre for Medium-Range Weather Forecasts (ECMWF), the Global Forecast System (GFS) run by NOAA, and several national models maintained by weather services around the world.
Every few hours, these models ingest millions of observations — surface weather stations, ocean buoys, aircraft sensors, radiosondes, and satellite instruments — and produce updated forecasts extending up to 16 days ahead. Short-range forecasts (1–3 days) are highly accurate, while extended forecasts (7–14 days) become increasingly uncertain. Understanding this uncertainty is key to using forecasts wisely.
Key Weather Metrics Explained
Temperature
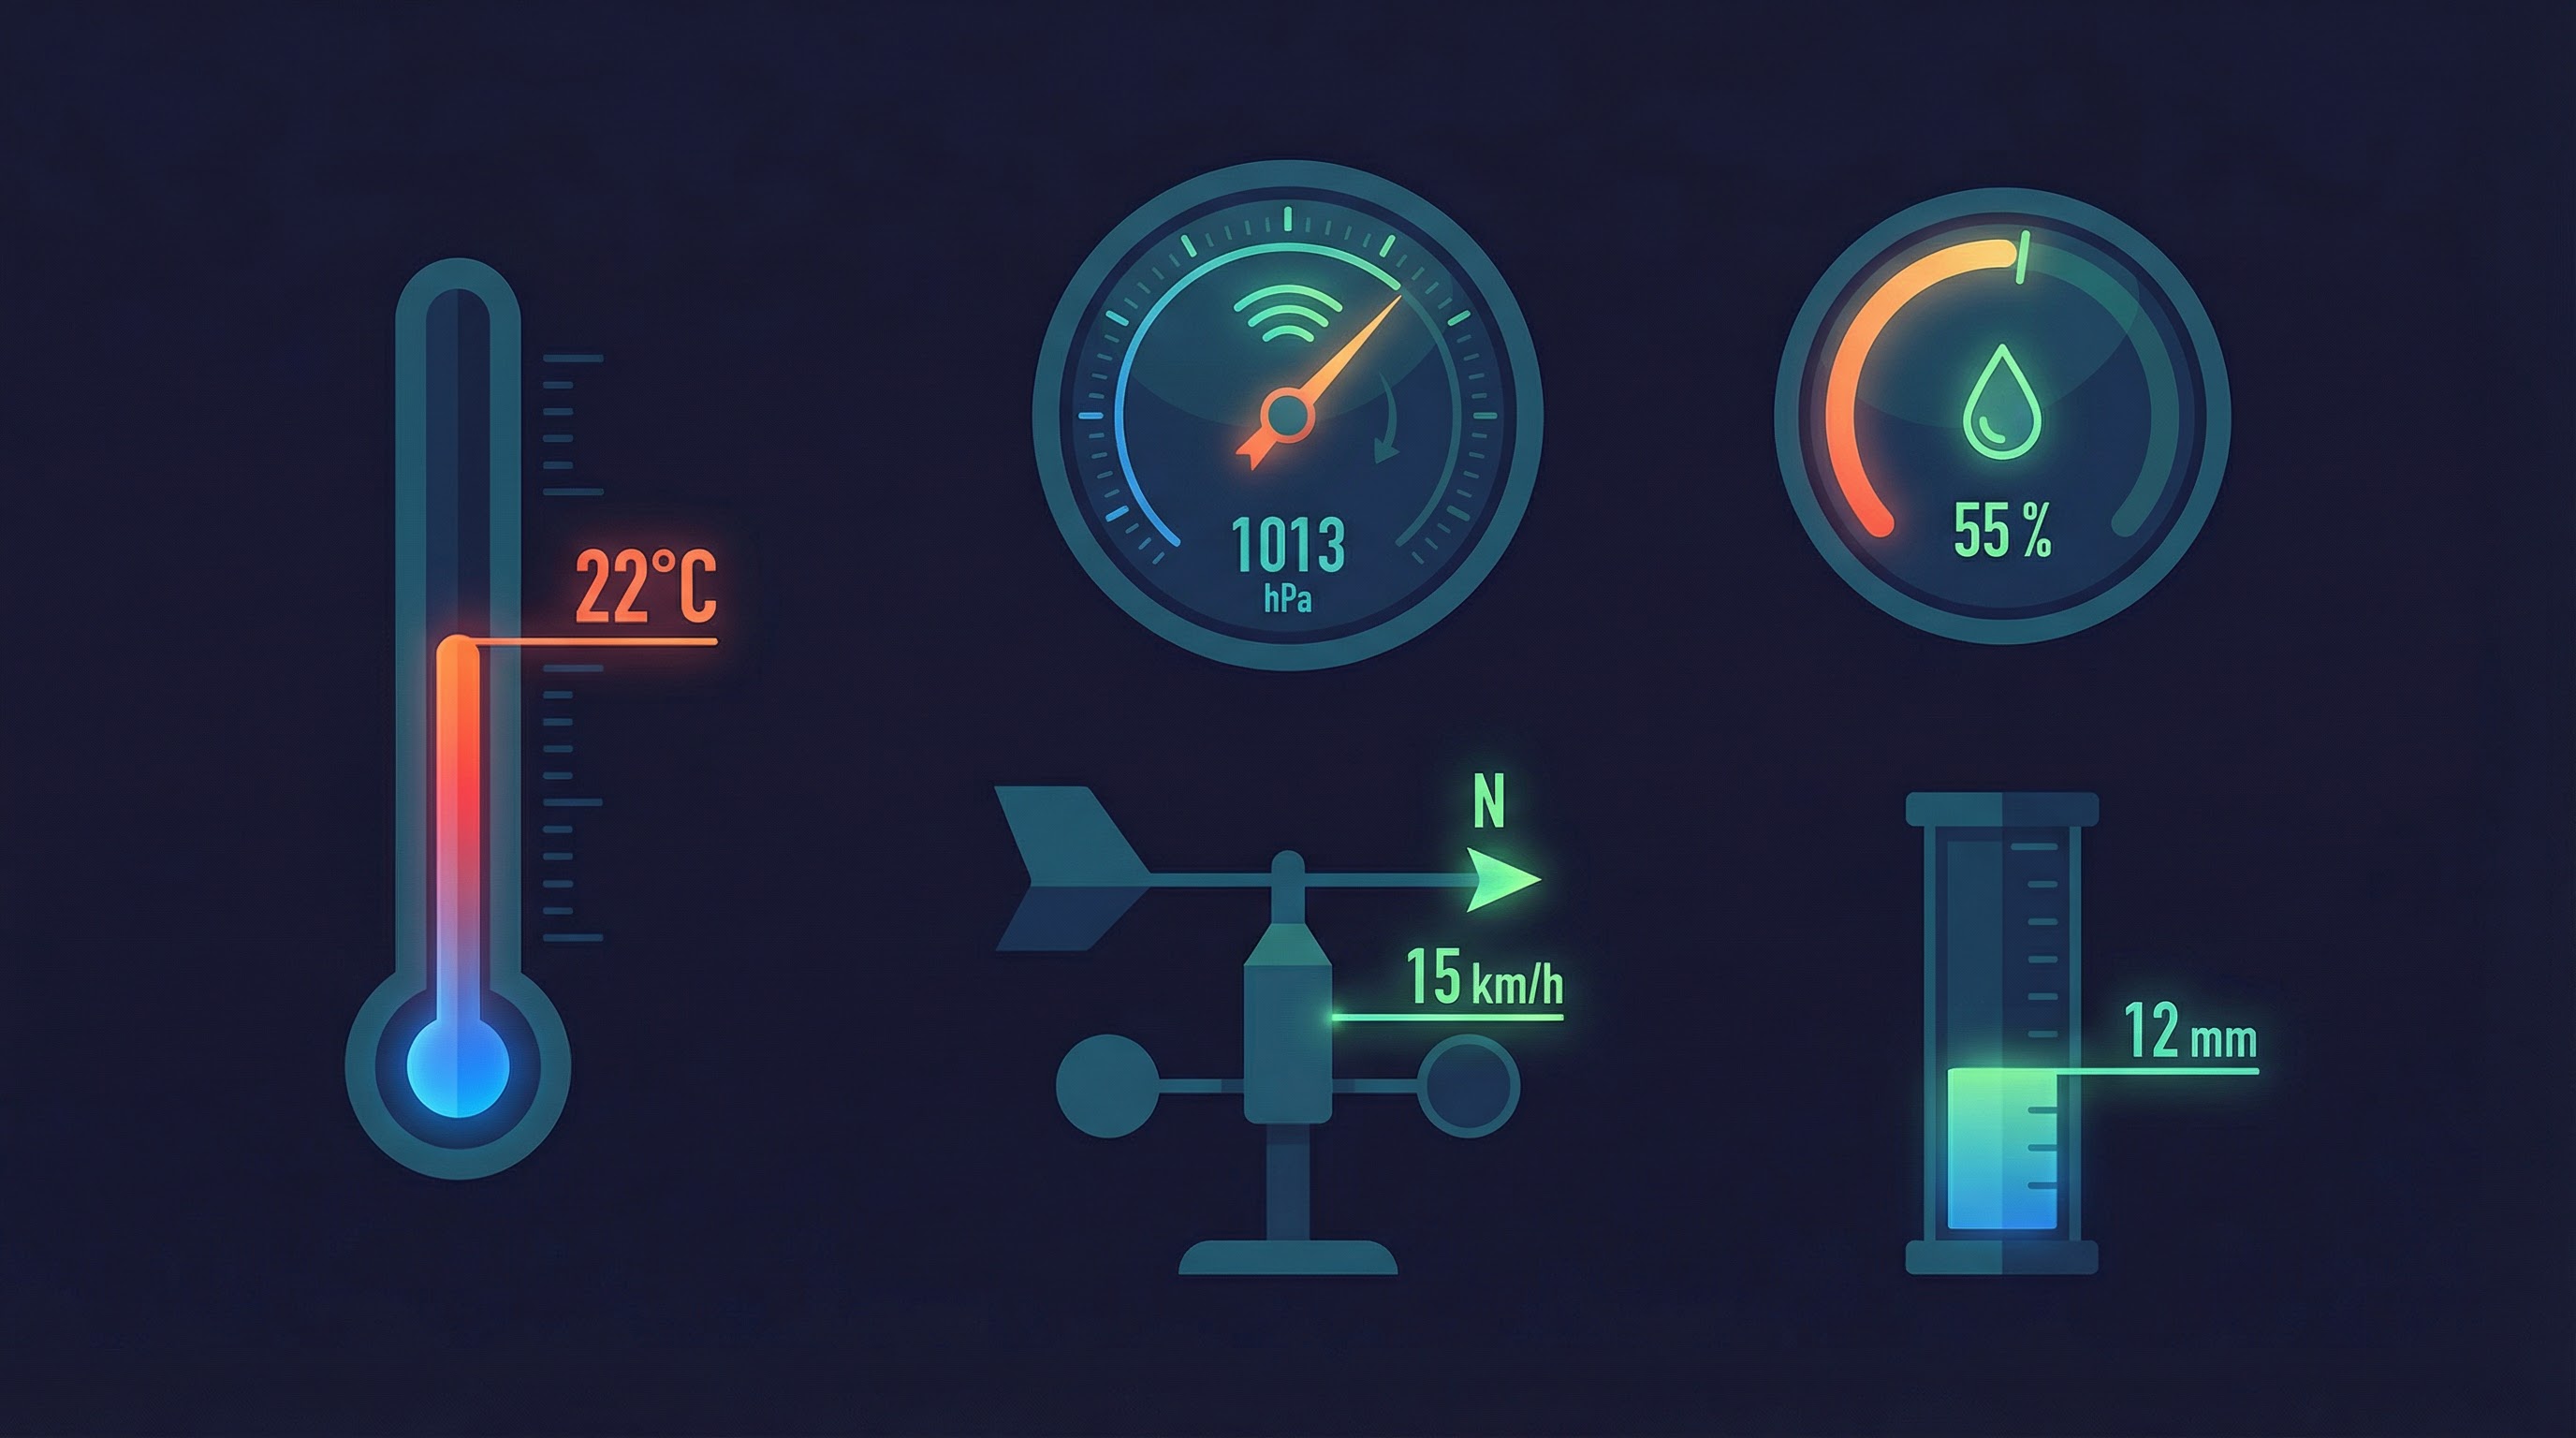
Temperature is measured at 2 meters above the ground in a shaded, ventilated enclosure (called a Stevenson screen) to avoid solar heating. Forecasts typically show the expected temperature and a "feels like" value that accounts for wind chill in cold weather and heat index in hot, humid conditions. The feels-like temperature is often more relevant for health decisions because it reflects how your body actually experiences the air. For instance, a 5°C day with strong winds can feel like -2°C, significantly increasing the risk of hypothermia during prolonged outdoor exposure.
Humidity
Relative humidity measures how saturated the air is with water vapor, expressed as a percentage. At 100% humidity, the air cannot hold more moisture and dew or fog may form. High humidity (above 60%) makes hot temperatures feel even hotter because sweat evaporates more slowly, reducing your body's ability to cool itself. Low humidity (below 30%) can cause dry skin, irritated sinuses, and increased static electricity. Ideal indoor humidity ranges between 30% and 50%.
Wind Speed and Direction
Wind speed is typically measured at 10 meters above the ground. Forecasts report sustained wind speed (the average over a period, usually 10 minutes) and sometimes gusts (brief, sudden increases). Wind direction is expressed as the compass direction the wind blows from — a "northwest wind" means the wind originates from the northwest and blows toward the southeast. Wind significantly affects how temperature feels on your skin and can influence air quality by dispersing or concentrating pollutants.
Precipitation
Precipitation forecasts tell you how much rain, snow, sleet, or hail is expected, usually measured in millimeters (or inches) of liquid equivalent. For snow, forecasters apply a snow ratio (typically 10:1 to 15:1) to convert liquid equivalent to actual snowfall depth, though this varies depending on temperature and moisture content.
High-value insight: A 40% "chance of rain" does not mean it will rain 40% of the day. It means there is a 40% probability that at least some rain will fall at your specific location during the forecast period. At Weather World AI, we recommend treating any chance above 30% as "bring an umbrella" — it is a meaningful possibility, not negligible.
UV Index
The UV index measures the intensity of ultraviolet radiation from the sun at the Earth's surface. It ranges from 0 (nighttime or very low) to 11+ (extreme). Values above 3 warrant sun protection (sunscreen, hat, sunglasses), and values above 8 mean unprotected skin can burn in under 15 minutes. The UV index peaks around solar noon and is higher at higher altitudes, lower latitudes, and during summer months. Cloud cover reduces UV but does not eliminate it — up to 80% of UV rays can penetrate thin clouds.
Weather Codes
The World Meteorological Organization (WMO) defines standardized weather condition codes that translate numerical values into human-readable descriptions like "clear sky," "partly cloudy," "moderate rain," or "heavy snowfall." On Weather World AI, we display these as weather icons alongside your forecast to give you an at-a-glance understanding of conditions.
Hourly vs. Daily Forecasts
Hourly forecasts break the day into individual hours, letting you plan activities with precision. They are most reliable within the next 24–48 hours. If you are deciding whether to run errands in the morning versus the afternoon, hourly data can reveal a brief rain window that a daily summary might hide.
Daily (multi-day) forecasts show high and low temperatures, total precipitation, and general weather conditions for each of the next 7–14 days. These are useful for longer-term planning — packing for a trip, scheduling an outdoor event, or preparing your garden. Keep in mind that accuracy decreases with each day: day-one forecasts are about 95% accurate, while day-seven forecasts drop to around 80%, and beyond day 10, forecasts are better understood as trends rather than precise predictions.
Pro Tips for Reading Forecasts — Common Mistakes to Avoid
At Weather World AI, we see users make the same mistakes repeatedly. Here is what we recommend:
- Mistake: Ignoring "feels like." The thermometer says 5°C, but wind chill makes it feel like -2°C. Dress for the feels-like number, especially in winter and summer. Our dashboard shows both — use it.
- Mistake: Relying on daily summaries for same-day plans. A "partly cloudy" daily summary can hide a 2-hour thunderstorm window. We recommend checking the hourly forecast for any outdoor activity happening today or tomorrow.
- Mistake: Treating 30% rain as "no rain." Thirty percent means roughly 1 in 3 similar situations produce rain. Bring an umbrella. It is not overkill.
- Mistake: Pairing weather with AQI. A sunny 25°C day with AQI 150 is not ideal for a long run. Ozone and PM2.5 spike in those conditions. Check our AQI Scale before strenuous outdoor exercise.
- Mistake: Skipping UV index. At Weather World AI, we recommend checking the UV index before 10:00 AM if you have sensitive skin. Apply sunscreen when UV is 3+, seek shade when it exceeds 6, and avoid prolonged exposure above 8.
How to Interpret Radar Maps
Radar maps show where precipitation is falling in real time. They are one of the most useful tools for short-term planning — but they are often misread. Here is what you need to know:
What the Colors Mean
Radar typically uses a color scale: green (light rain), yellow (moderate), orange (heavy), red (very heavy or hail). The key insight: colors show reflectivity (how much the radar beam bounces back), not necessarily rainfall rate. Drizzle can appear light green; intense thunderstorms show up as red or purple. Movement of the colored blobs indicates storm direction and speed — if a red cell is 50 km west and moving east at 40 km/h, you have roughly an hour before it arrives.
Common Radar Pitfalls
Radar can show "false echoes" from buildings, mountains, or birds. Ground clutter appears as stationary patches. Meteorologists filter these out, but consumer apps sometimes show raw data. Another pitfall: radar measures precipitation aloft, not always at ground level. Virga — rain that evaporates before reaching the ground — can appear on radar but never hit your location. We recommend using radar as a supplement to the forecast, not a replacement. Check our Weather Dashboard for the probability and timing, then use radar to refine your timing for the next 1–2 hours.
Our Data Sources: Transparency and Trust
Weather World AI is committed to transparency about where our data comes from. We utilize data from reputable weather and air quality providers to ensure accuracy and reliability:
- Open-Meteo — Our primary weather API. Open-Meteo aggregates forecasts from multiple national weather services and numerical weather prediction (NWP) models, including the European Centre for Medium-Range Weather Forecasts (ECMWF) and NOAA's Global Forecast System (GFS). This blending approach provides the most accurate composite forecast available.
- NOAA (National Oceanic and Atmospheric Administration) — The U.S. GFS model, operated by NOAA, is one of the world's most widely used global forecast systems. It runs at approximately 13 km resolution and is updated four times daily.
- ECMWF — The European model is widely regarded as the most accurate for medium-range forecasts (3–10 days). Open-Meteo incorporates ECMWF data where available.
- OpenAQ and WAQI — For air quality data, we use OpenAQ (a global air quality data platform) and the World Air Quality Index (WAQI) project, which aggregate real-time measurements from thousands of monitoring stations worldwide.
By combining these trusted sources, we deliver forecasts and air quality data you can rely on for planning your day and protecting your health.
Why Forecasts Sometimes Differ
Different weather services may show slightly different forecasts because they use different NWP models, update at different times, or apply different post-processing techniques. No single model is always "best" — the ECMWF tends to excel at medium-range forecasts globally, while regional models like HRRR (High-Resolution Rapid Refresh) provide superior detail for short-term local weather. Weather World AI uses Open-Meteo, which blends multiple national weather service models to provide the most accurate composite forecast available.
Ready to check your forecast?
Head to the Weather Dashboard for real-time weather data and AI-powered insights for your location.
Weather World AI Editorial Team
This article was written and reviewed by our core team of meteorology enthusiasts and environmental health researchers. We rely on open, government-backed data sources (like NOAA and ECMWF) and adhere to strict editorial standards to ensure our weather, climate, and air quality information is accurate, up-to-date, and actionable.